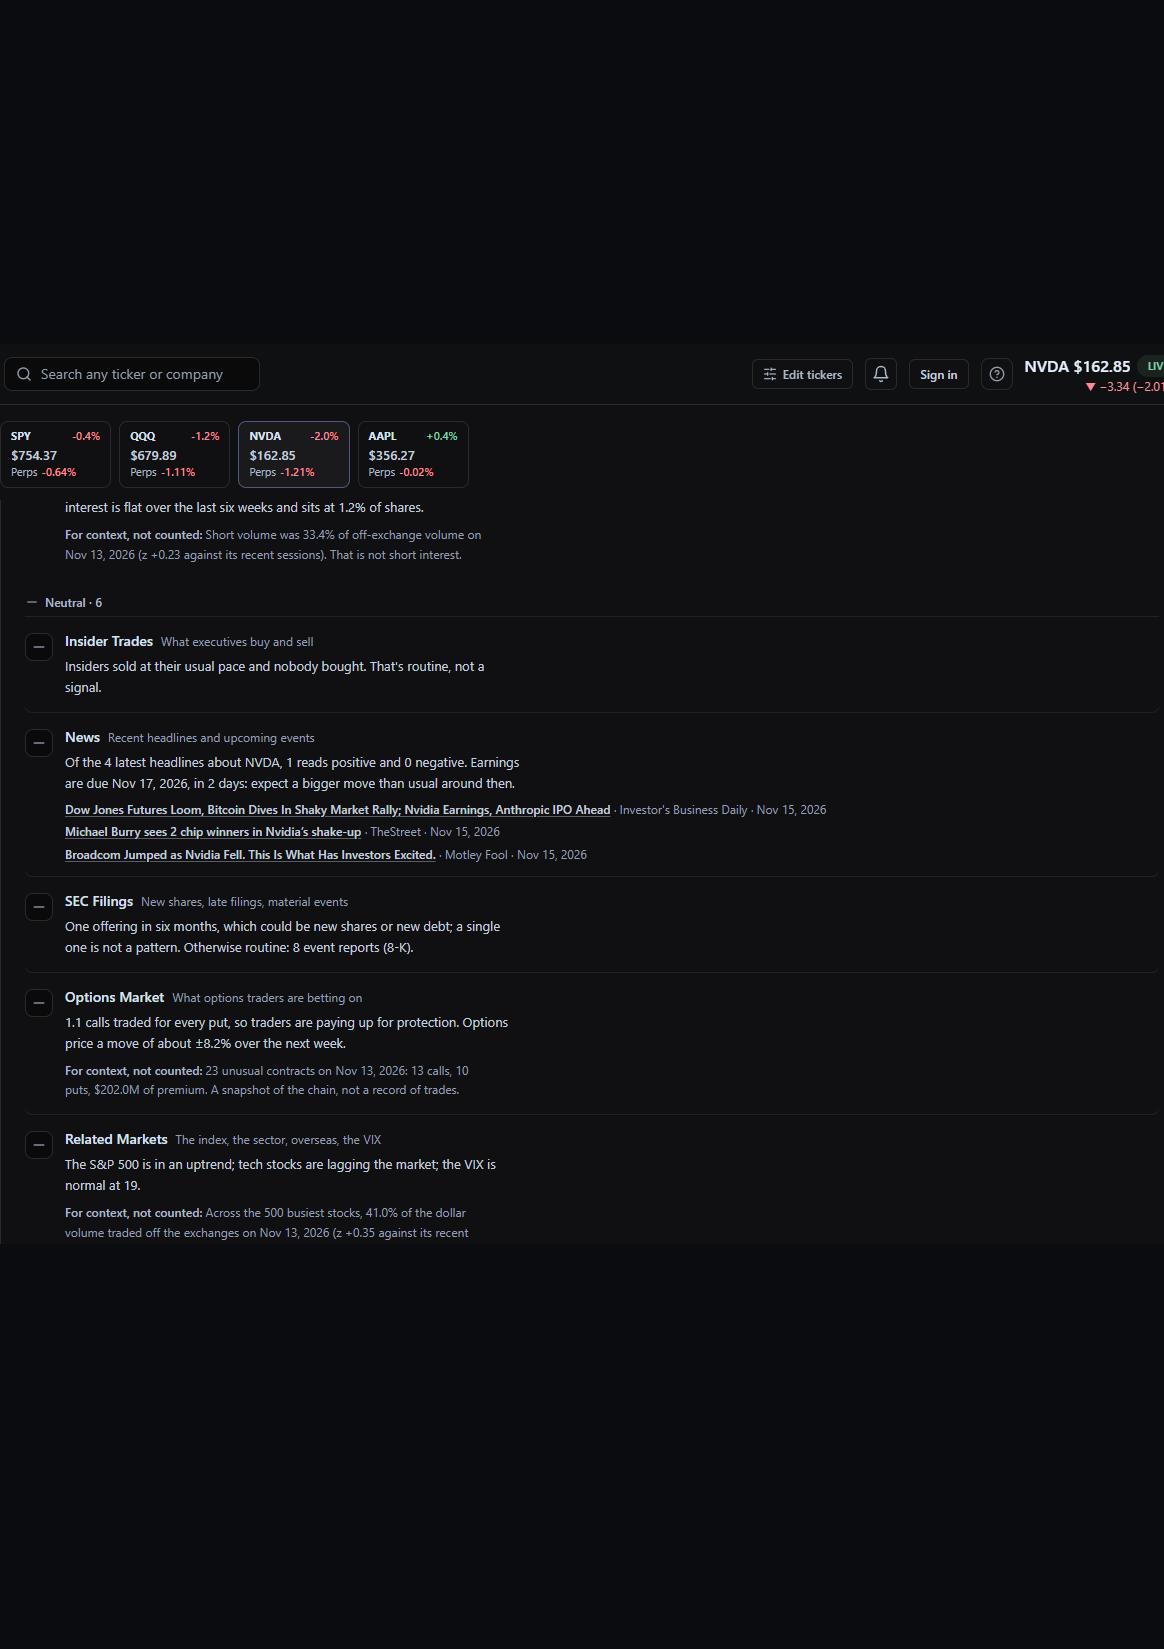
Every vote in plain words
Each seat says what it read and why it voted. Switch to Every number for its figures and its rule.
Shown: NVDA at Friday's close, 13 Nov 2026.
 Oracular
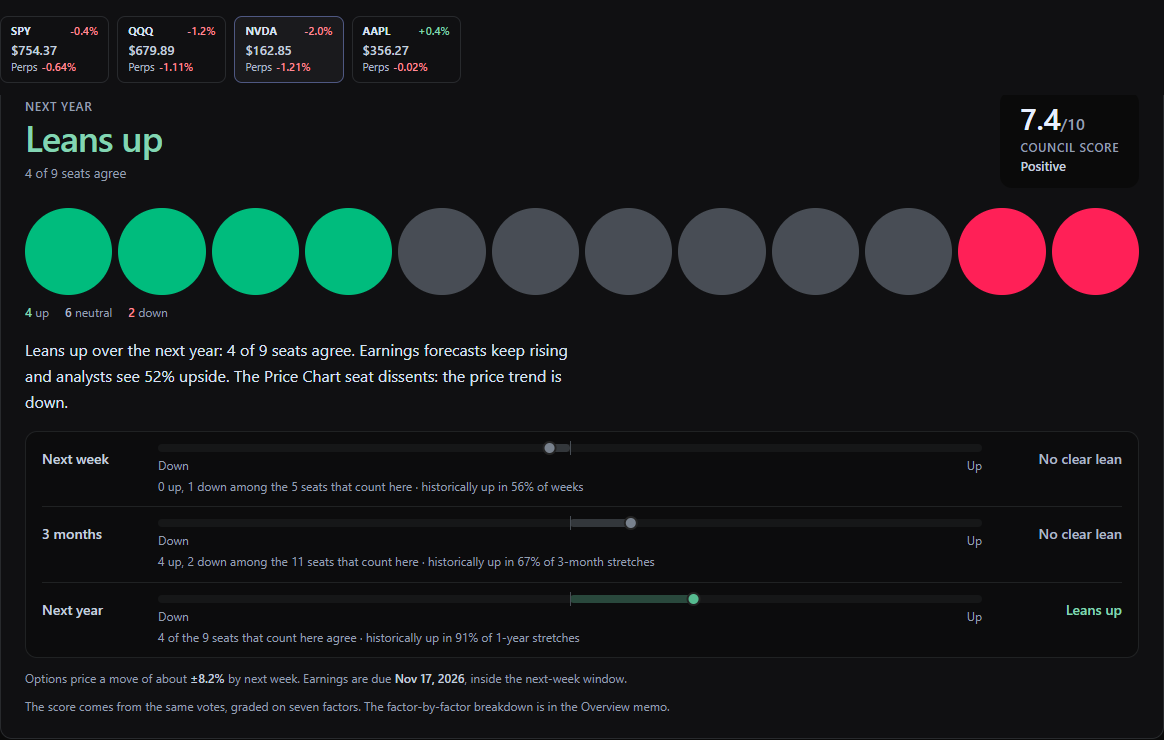
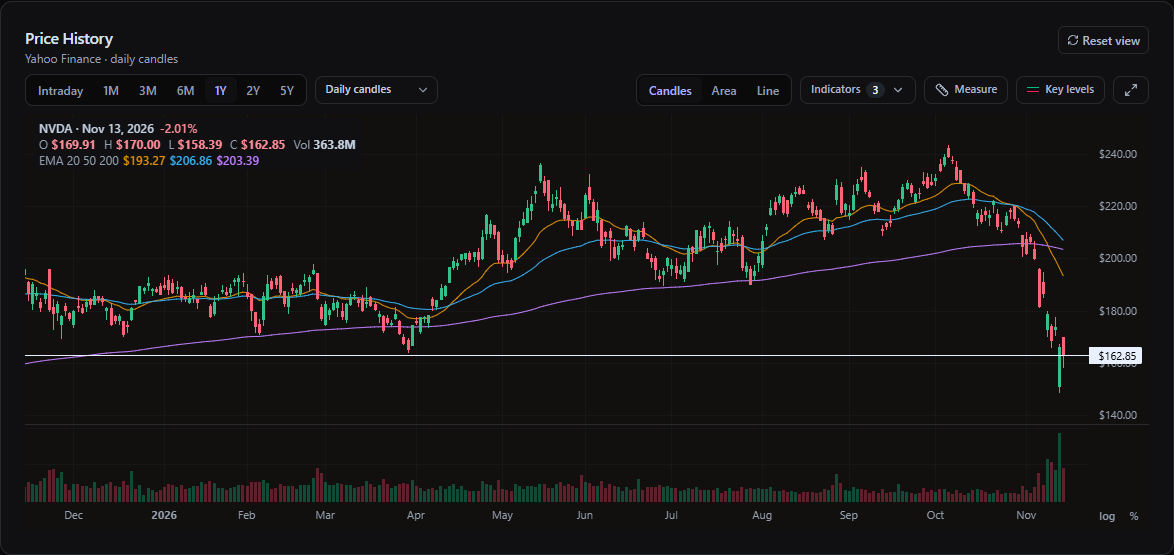
The Council on NVDA, at Friday's close (13 Nov 2026)
Oracular is a free research terminal for any US stock, ETF or crypto pair. Each seat reads one kind of live data and votes by a rule you can read; the AI only argues both sides.
Open OracularFrom the Council's scan of about a thousand of the most-traded US stocks. Try one:
Twelve seats, twelve kinds of data: the price chart, the company's SEC filings, analyst targets, earnings forecasts, insider trades, big funds, news, the options market, the economy, related markets and the calendar. A source that is down makes its seat sit out and say why.
Every model in Oracular was checked against data it was not fitted on, and against chance. Where one doesn't hold up, the app says so on screen.
The squeeze model's AUC out of sample: weights from 2021–24, tested on 2025–26 across 747 US companies.
How often the top tenth of squeeze readings squeezed, against the base rate, in that out-of-sample test.
A chart pattern is drawn only if it beat the 97.5th percentile of random entries in 2021–24 and again in 2025–26.
A month counts as seasonal only if it stands out after allowing for testing all twelve. Luck alone passes one about half the time.
Seats, each with its rule printed under Every number, so you can disagree with a vote and say why.
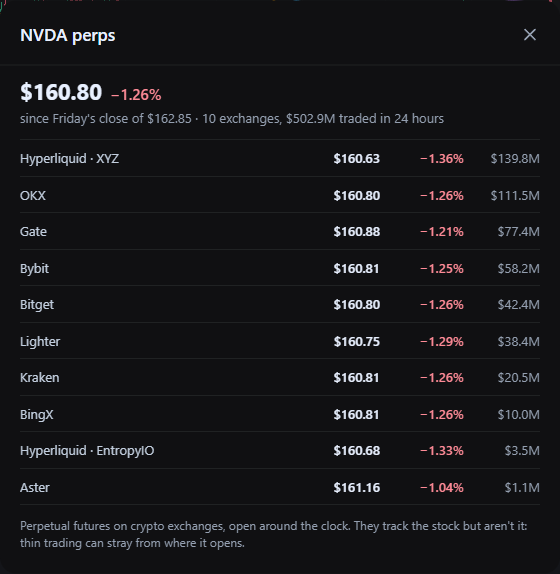
Crypto exchanges at most, read for a stock's price on weekends and overnight, when the market is shut.
Indicators in the Fear & Greed Index, each scored by how far it sits from its own usual swings.
How often the Council reads about a thousand of the most-traded US stocks for the Scanner.
Each seat says what it read and why it voted. Switch to Every number for its figures and its rule.
Shown: NVDA at Friday's close, 13 Nov 2026.

The deepest drops in the price history, how long each lasted and how long it took to win back, or how far it still has to go.
On weekends and overnight, stocks trade as perpetual futures on crypto exchanges. Oracular reads each venue, shows the volume-weighted price and says what it can't tell you.
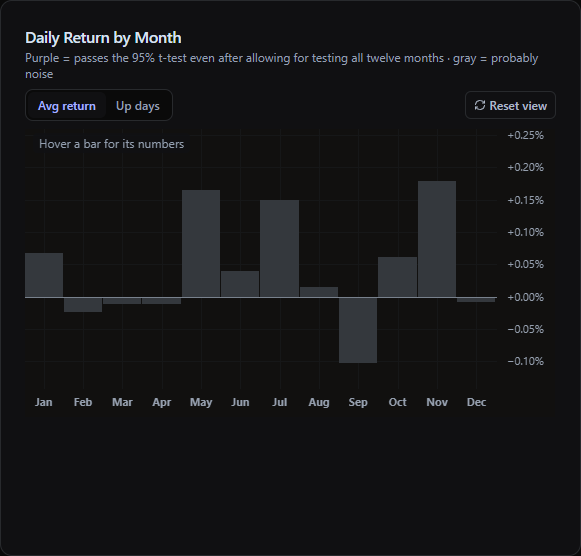
Average return by month and weekday, each tested for its sample size and corrected for testing them all. Grey means probably noise, and it usually is.
Pinch or scroll to zoom, drag to pan, drag the price axis to stretch it. Indicators and your own Pine scripts sync to every device when you sign in.
No. Everything is general information, the same for everyone. Oracular never says buy or sell, and the AI won't answer "should I buy" about your money.
Nothing. You don't need an account to look anything up. Sign in with Google to keep your tickers, settings and alerts on every device.
Yahoo Finance and Nasdaq for prices and fundamentals, SEC EDGAR for filings and insider trades, FINRA for short interest, FRED for the economy, and crypto exchanges for weekend prices. A source that's down shows as missing, never as a guess.
It argues the bull and the bear case from the seats' numbers, and a Challenger looks for the hole. It never votes, never supplies a figure and never raises a red flag; a line that quotes a number the seats didn't give is left out.
Any US-listed stock or ETF, the major indices, and crypto pairs such as BTC-USD.
Yes. In your phone's browser choose Add to Home Screen; on a computer, Install. It opens like an app, with shortcuts to Today, Scanner, Earnings and Alerts.
No. Everything is general information, the same for everyone. Oracular never says buy or sell, and the AI won't answer "should I buy" about your money.
Opens the stock in Oracular, where its twelve seats vote on live data. Free, no account needed. General information, not investment advice.